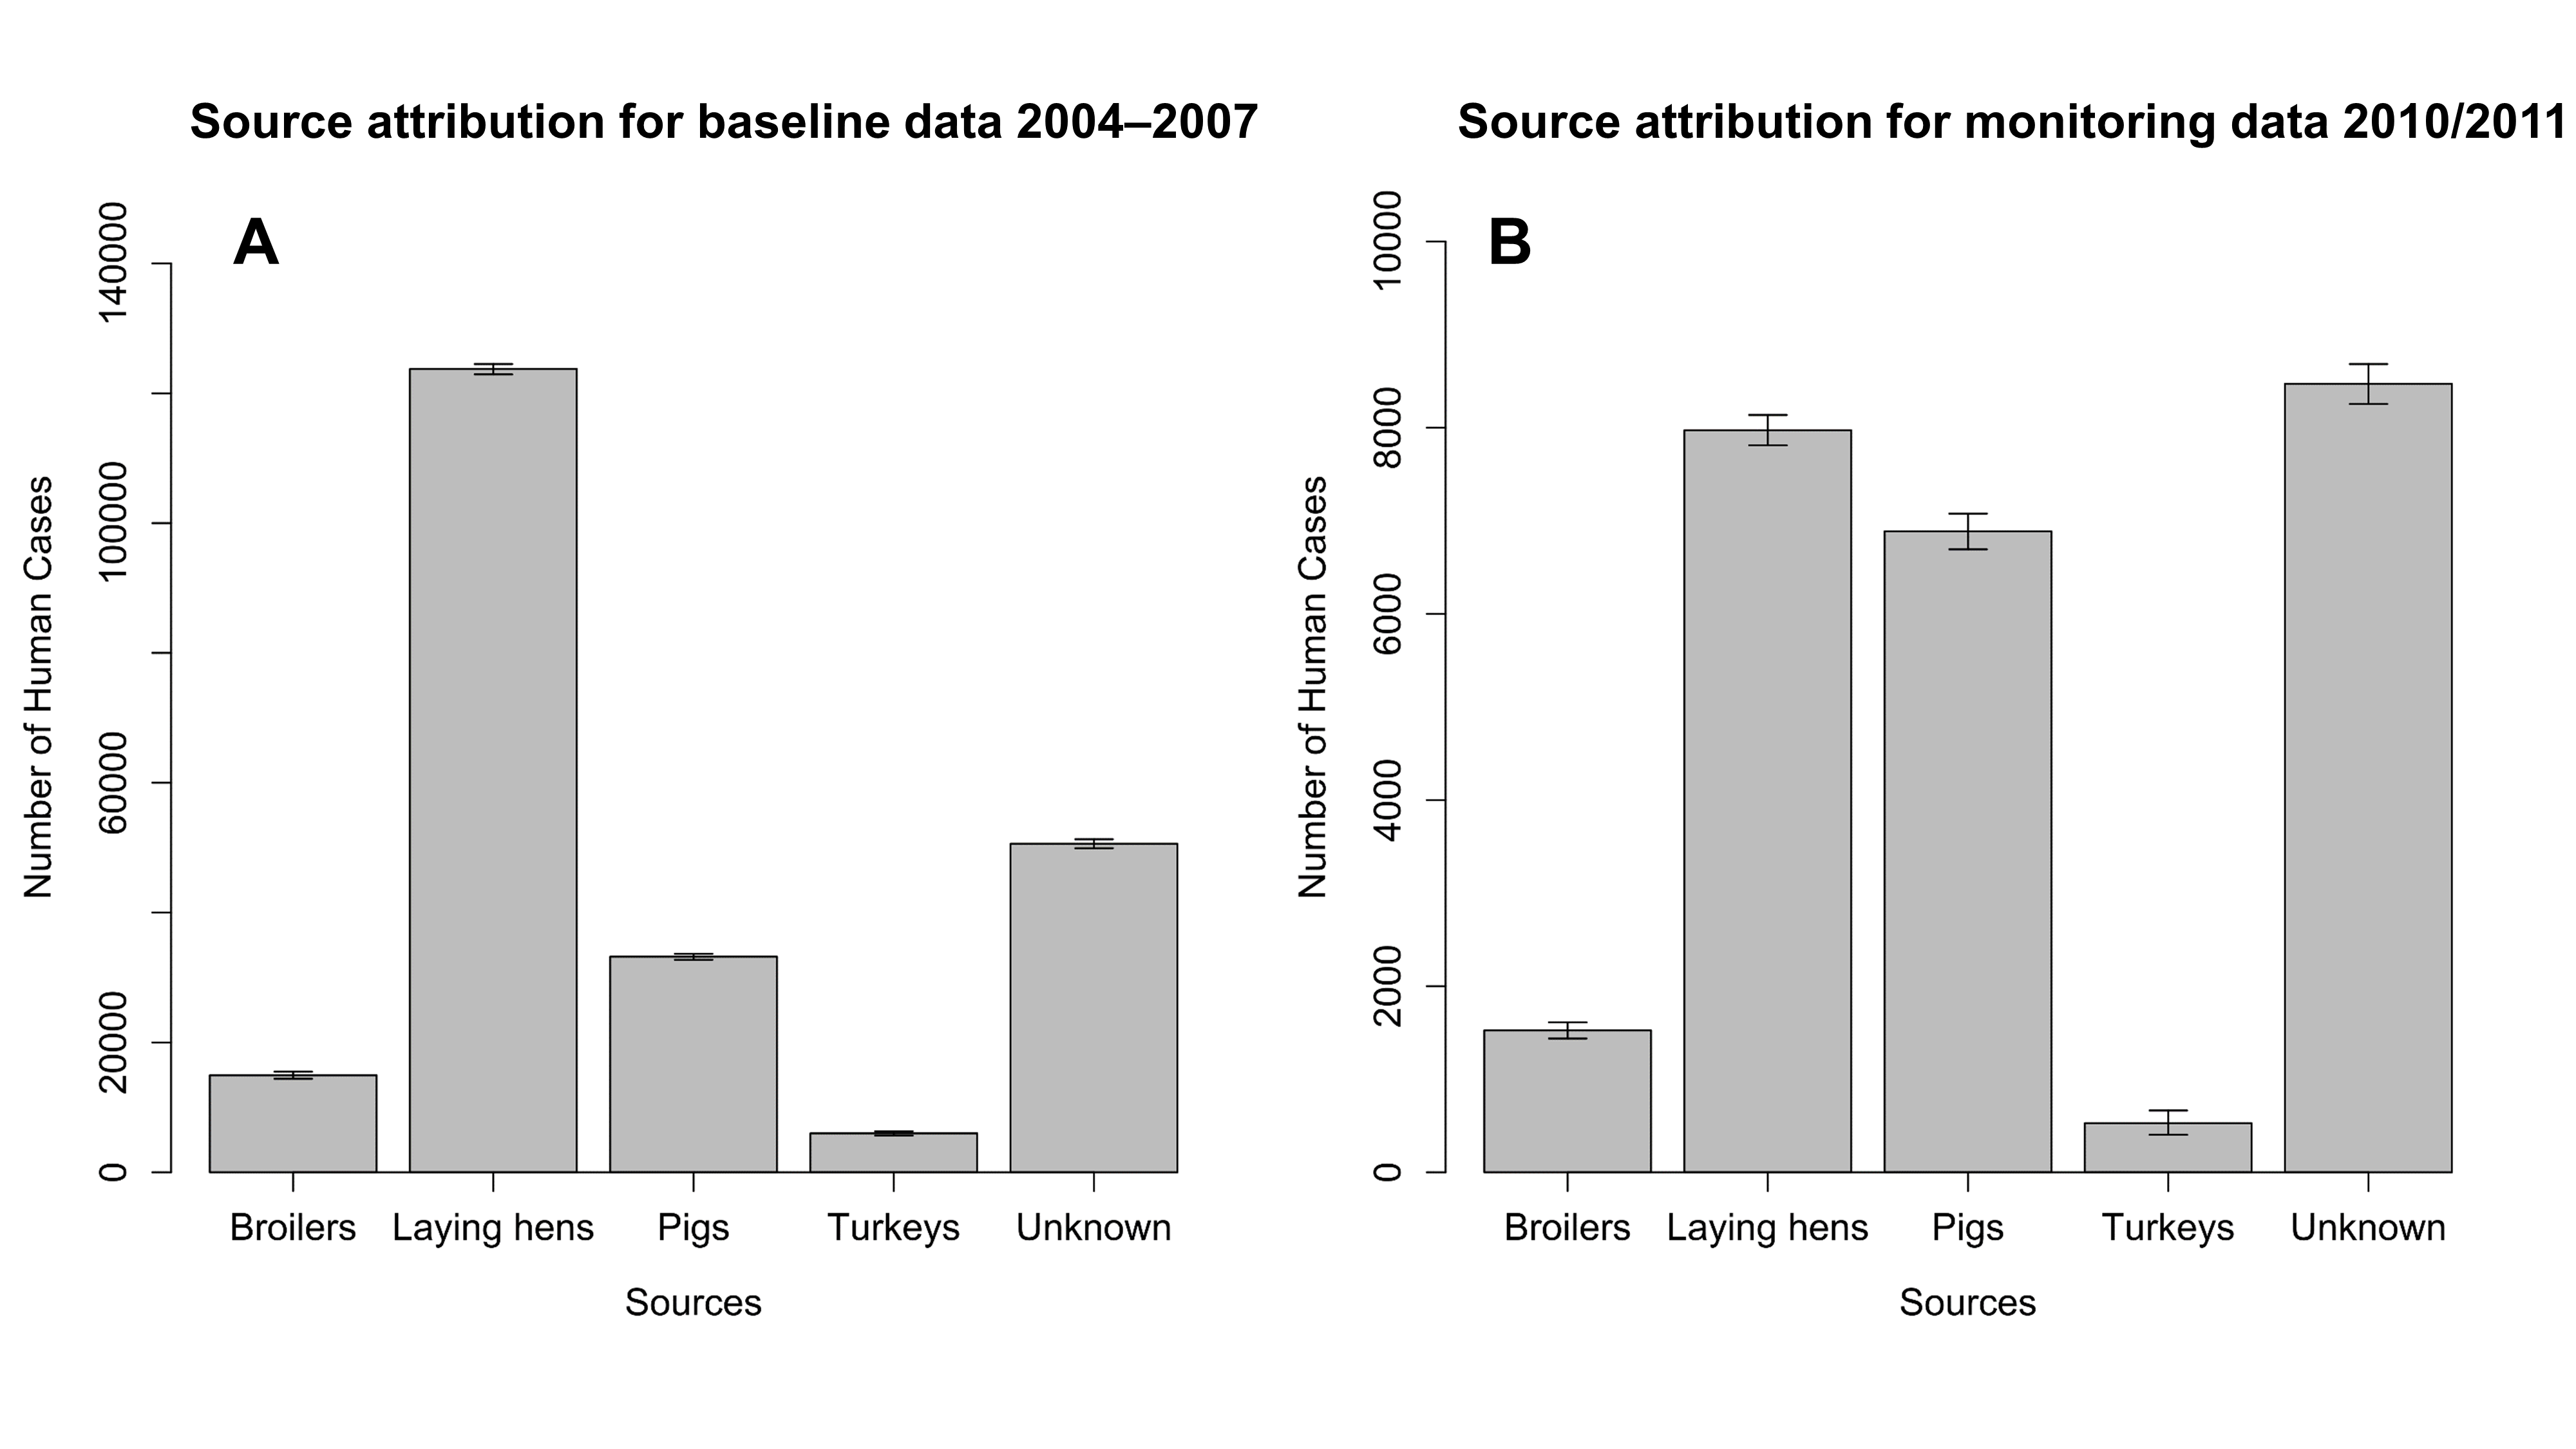
Bar plot of number of human cases of Salmonella infection attributed to different sources. Subfigure A shows the result for the baseline data 2004–2007 (the so-called defaultSimulation in Table
|
|
||
|
Bar plot of number of human cases of Salmonella infection attributed to different sources. Subfigure A shows the result for the baseline data 2004–2007 (the so-called defaultSimulation in Table |
||
| Part of: Sundermann EM, Correia Carreira G, Käsbohrer A (2021) An FSKX compliant source attribution model for salmonellosis and a look at its major hidden pitfalls. Food Modelling Journal 2: e70008. https://doi.org/10.3897/fmj.2.70008 |