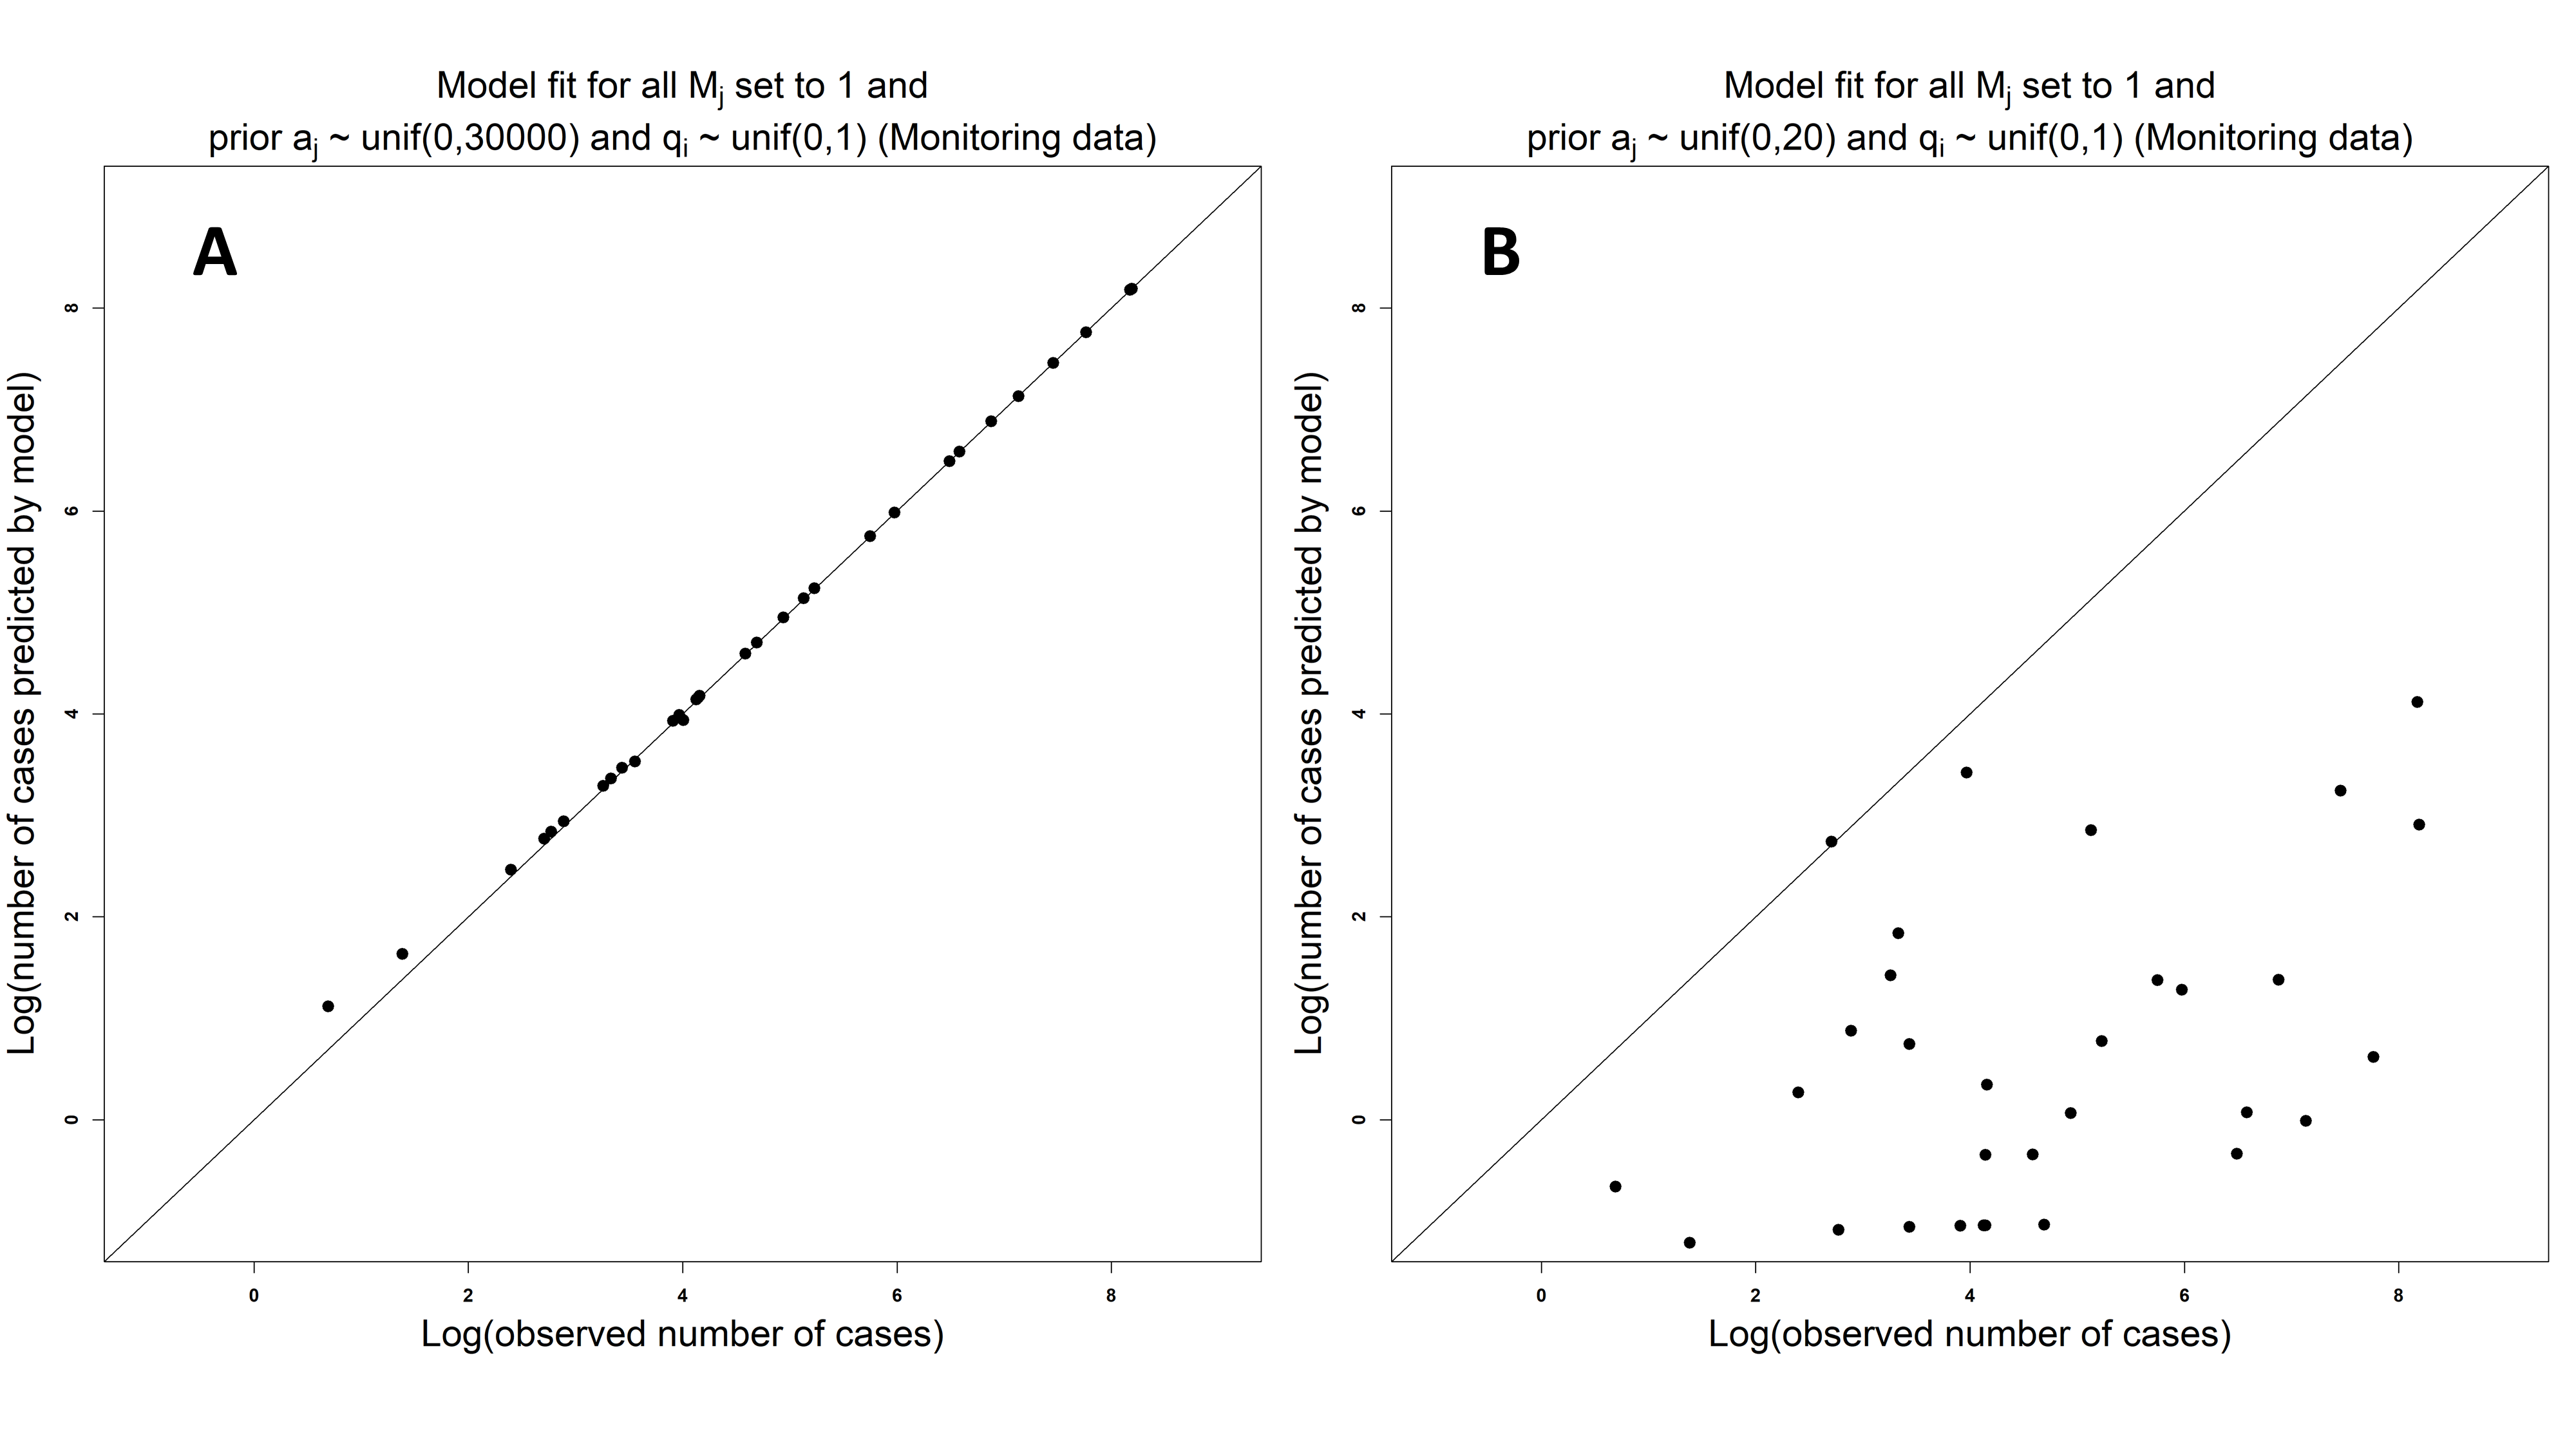
Model-data fit when setting \(M_j\)=1 and using different parameterizations. Each point in the figure corresponds to one bacterial subtype. Subfigure A shows a consistent model fit due to using the prior \(a_j \sim uniform(0,30000)\). I.e. the logarithm of the number of cases as found in the data corresponds well to the logarithm of predicted number of cases. Subfigure B shows an inconsistent model fit due to using the prior \(a\sim uniform(0,20)\). Here, the model systematically underestimates the number of cases for the subtypes as the points gather well below the identity line.